


How Does Disney Deal with Money Problems at Their Theme Parks?
By Joanne Cassar / 06. Sep 2025
read more

By Helneski / 17. Oct 2022

IC Markets - Regulated By FSA
The price of gold has rebounded from a new monthly low ($1643) as it strives to reverse the loss following the US Consumer Price Index (CPI) report, but it may struggle to maintain the comeback from the annual low ($1615) as it fails to defend the starting range for October.
After failing to defend its monthly opening range, the gold price is vulnerable.
The price of gold looks to be duplicating the price action from August as it followed the negative slope in the 50-Day SMA ($1711), and the precious metal may continue to fall in the coming days as Treasury yields rise to new yearly highs.
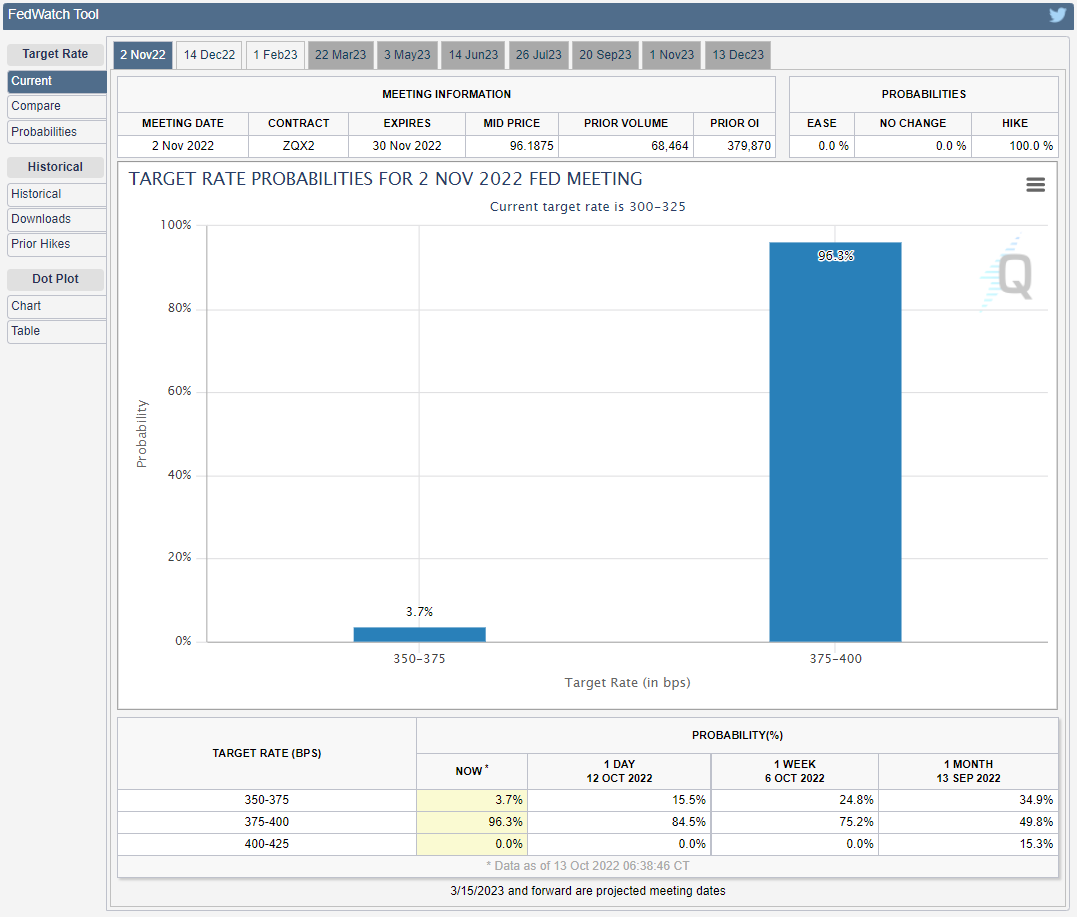
Expectations for higher US interest rates appear to be dragging on the price of gold as the Federal Reserve maintains its current approach to combating inflation, and bullion may face additional headwinds ahead of the next Fed interest rate decision on November 2 as it puts pressure on the Federal Open Market Committee (FOMC) to pursue a highly restrictive policy.
Source: CME
Looking forward, the CME FedWatch Tool currently predicts a higher than 90% chance of another 75bp rate rise amid continued price growth in the United States, and the FOMC may issue hawkish forward guidance for the rest of the year as the central bank tries to contain inflation.
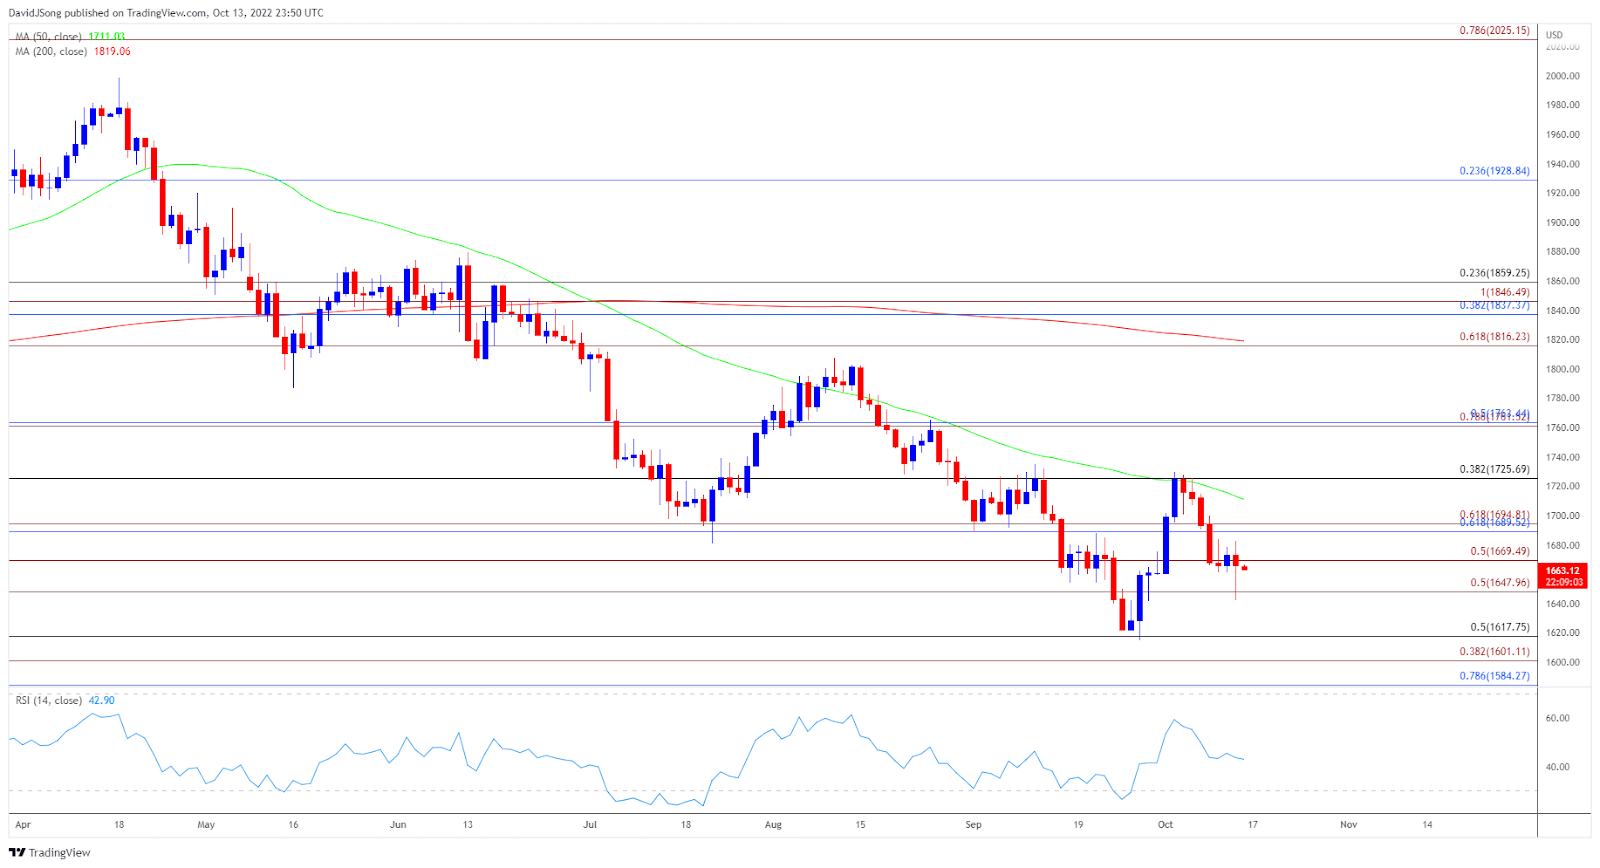
With that stated, gold may continue to track the negative slope in the 50-Day SMA ($1711) as it battles to stay above the moving average, and gold may give up the recovery from the annual low ($1615) as it fails to defend the opening range for October.
Source: Trading View
Gold is trading at a new monthly low ($1643) after failing to hold above the 50-Day SMA ($1713), and the precious metal may continue to pursue the downward slope in the moving average, as it did in August.
A closing below the $1648 (50% expansion) zone is required to put the Fibonacci overlap at $1601 (38.2% expansion) to $1618 (50% retracement) on the radar, with a break below $1584 (78.6% retracement) bringing the April 2020 low ($1568) into play.
However, a failure to close below the $1648 (50% expansion) zone may result in range-bound circumstances in the gold price, with a rise above the $1690 (61.8% retracement) to $1695 (61.8% expansion) area boosting the possibility of another test of the moving average.


By Joanne Cassar / 25. May 2025
read more